Fondren performs a myriad of functions that are best expressed with stats and numbers rather than through prose..
Access Services By The Numbers
Infographic: https://rice.box.com/s/jhfutolrl3cp4eyeq7706q2cjvv7yadv
Digital Media Commons By the Numbers
- Number of posters printed
- Total posters printed: 1,620
- Busiest day: 39 posters printed, Tuesday, April 9, 2024
- About 5 per day on average
- Equipment checkouts
- Total checkouts: 2,530
- Busiest day: 60 checkouts and returns, Monday, November 27, 2023
- About 17 equipment checkouts and returns per day on average
- Studio usage
- Total uses: 309
- Busiest day: 4 usages, Thursday, April 4, 2024
- More than once a day on average
Note that the average number is calculated based on the 300 days DMC opens.
E-Resources by the Numbers
Number of ebooks in our catalog at the end of FY24: 2,039,918
Number of ejournals: 194,955
Number of databases: 681
Number of streaming media: 228,731
E-resources usage: 1,387,794
Reference and Research Guide Usage
Live chat sessions: 320
Reference asynchronous questions: 1252
Total reference transactions: 1572
Total FAQ Public Views: 9,895
Top 10 FAQ’s from the FAQ System
- How can I access the Houston Post archives via your website? (793)
- Is the library open to the public? (577)
- Do you have an alumni directory? (335)
- Where should I park when I come to visit the library? (297)
- How can I find dissertations? (243)
- How can I find how many citations a faculty member has had over the last 5 years? (233)
- Is free wifi access available to library visitors? (232)
- Is there a food vending machine in the library? (193)
- How can I access online journals and databases from off campus? (176)
- What is on each of Fondren Library's floors? (175)
Research Guides:
Total Number of all published guides: 292
Total views of all published guides: 81,377
Top 15 guides by views:
- NAICS and SIC Codes (5859)
- The Holocaust (4018)
- Archives of the Impossible (3674)
- Slave Narratives from the Federal Writers’ Project, 1936-1938 (3240)
- The Golden Girls (2202)
- Newspapers (2030)
- Graduate Students & Postdocs at Rice University (2026)
- Paranormal Studies (1990)
- Film (1737)
- X-Ray Crystallography (1534)
- Creating Effective Academic Posters in PowerPoint (1506)
- Artificial Intelligence and ChatGPT (1289)
- Course Materials (1281)
- PTRC: Patents, Trademarks, and Copyrights (1252)
- Joan and Stanford Alexander South Texas Jewish Archives (1140)
Digital Scholarship Services Workshops
Instructional data overview data visualization
In the 2023-2024 fiscal year, members of Digital Scholarship Services offered 172 short courses and in-class workshops, totaling over 230 hours of instruction. Topics spanned intellectual property and patents offered by the Kelley Center for Government Information, the R programming language by Research Data Services, GIS mapping by the GIS/Data Center, and Photoshop, Illustrator, Podcasting, and digital photography and video by the Digital Media Commons.
Over 1,100 undergraduate and graduate students, staff, faculty, postdocs, and other community members took advantage of the instruction, combining for almost 1,600 hours of engagement.
Anna Xiong and Sean Smith created a new series of Excel workshops aimed at supporting staff needs across campus, and it will continue to be taught by the Kelley Center.
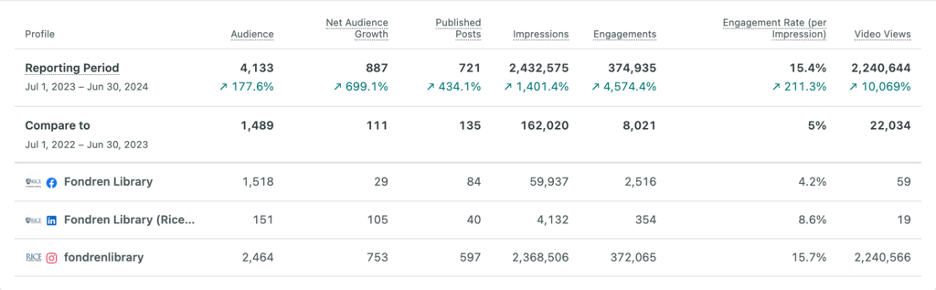
Social Media
At a Glance:
Audience: 4,133 (+177.6%)
Net Audience Growth: 887 (+699.1%)
Impressions: 2,432,575 (+1,401.4%)
Engagements: 374,935 (+4,574.4%)
Post Link Clicks: 292 (+204.2%)
Engagement Rate: 15.4% (+211.3%)
Shares: 43,512 (+15,956.1%)
Video Views: 2,240,644 (+10,069%)
Total Posts: 721
Audience Growth
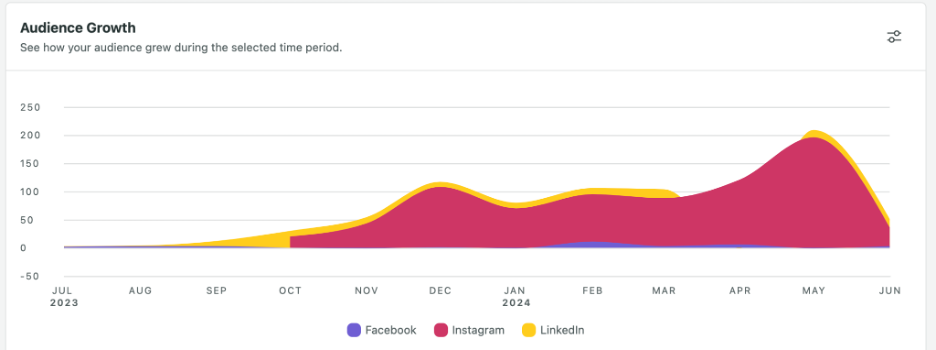
Net Audience Growth: 887 total followers across platforms (+699.1%)
● Facebook Net Follower Growth: 29 (-60.8%)
● Instagram Net Follower Growth: 753
● LinkedIn Net Follower Growth: 105 (+183.8%)
Impressions:
Total across platforms: 2,432,575 (+1,401.4%)
● Facebook: 59,937 (+93.5%)
● Instagram: 2,368,508 (+1,709.4%)
● LinkedIn: 4,132 (+2,872.7%)
Engagements:
Total across platforms: 374,935 (+4,574.4%)
● Facebook: 2,516 (+90.8%)
● Instagram: 372,065 (+5,464.8%)
● LinkedIn: 354 (2,112.5%)
Video Views:
Total across platforms: 2,240,644 (+10,069%)
● Facebook: 59 (+210.5%)
● Instagram: 2,240,566 (+10,077.5%)
● LinkedIn: 19
LSC By the Numbers
Total Inventory: 1,248,731